📘 App Guide

How to use the VFR Wetter app

A tour through every tab and feature of the app – from the central flight weather assessment through route planning and Go Fly to the widget, language and subscription. We deliberately don't publish the exact weighting of individual weather factors in the assessment – that's the core of the app.

Looking for general flight-weather basics, independent of this app? Head to Learn instead.

Getting started

Three short steps after launch, before you use the app.

⚠️

Disclaimer

A clear notice at every app launch: VFR Wetter is a tool for private flight preparation, not a replacement for an official flight weather briefing.

🎁

7-day free trial

Afterwards, a subscription gate checks your purchase status. Without an active subscription you'll see the paywall – cancellable anytime in the Google Play Store.

📍

Location or search

By GPS or by searching ICAO code, airport name or city across ~19,000 airports – the search works fully offline.

Current tab: the central assessment

The first tab you see summarizes the weather situation in one card.

The recommendation card shows one of three statuses – Flyable, Marginal or No-go – together with source chips (e.g. METAR, DWD, MOSMIX) and the main reason. If an airport with its own METAR/TAF is selected, that official report takes priority; official DWD and MeteoAlarm warnings apply on top of that.

Exactly how the individual factors – visibility, clouds, wind, gusts, precipitation, thunderstorm risk and more – are weighted and combined in detail is something we deliberately don't publish. But the expandable "Why this assessment?" row always shows the reasons that mattered in this specific case, plus a data-quality score (stars) and a short-term trend for the next three hours.

Below that you'll find the "Since HH:MM" card (what's changed since the last refresh), "If you launch now" (a traffic-light outlook for the next three hours) and the live sun position with day/golden-hour/twilight phase.
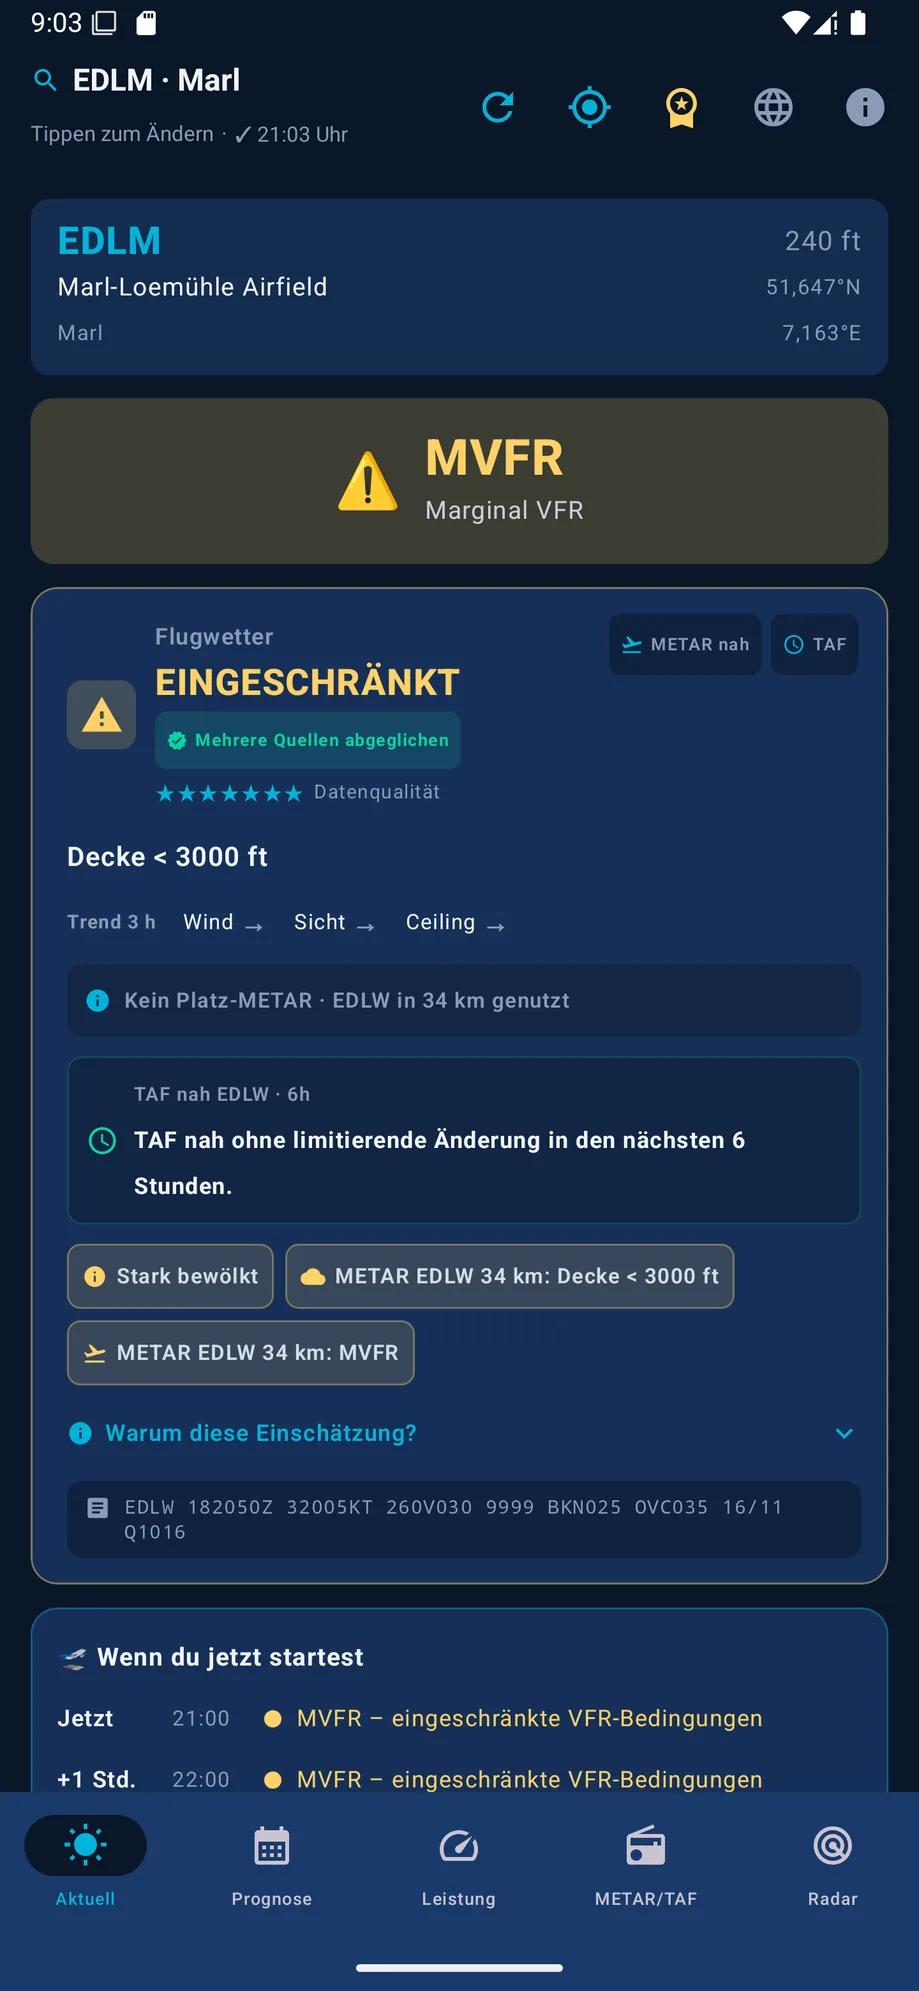
Central flight weather assessment in the Current tab

Airport search & favorites

Quick access to the airports you use most.

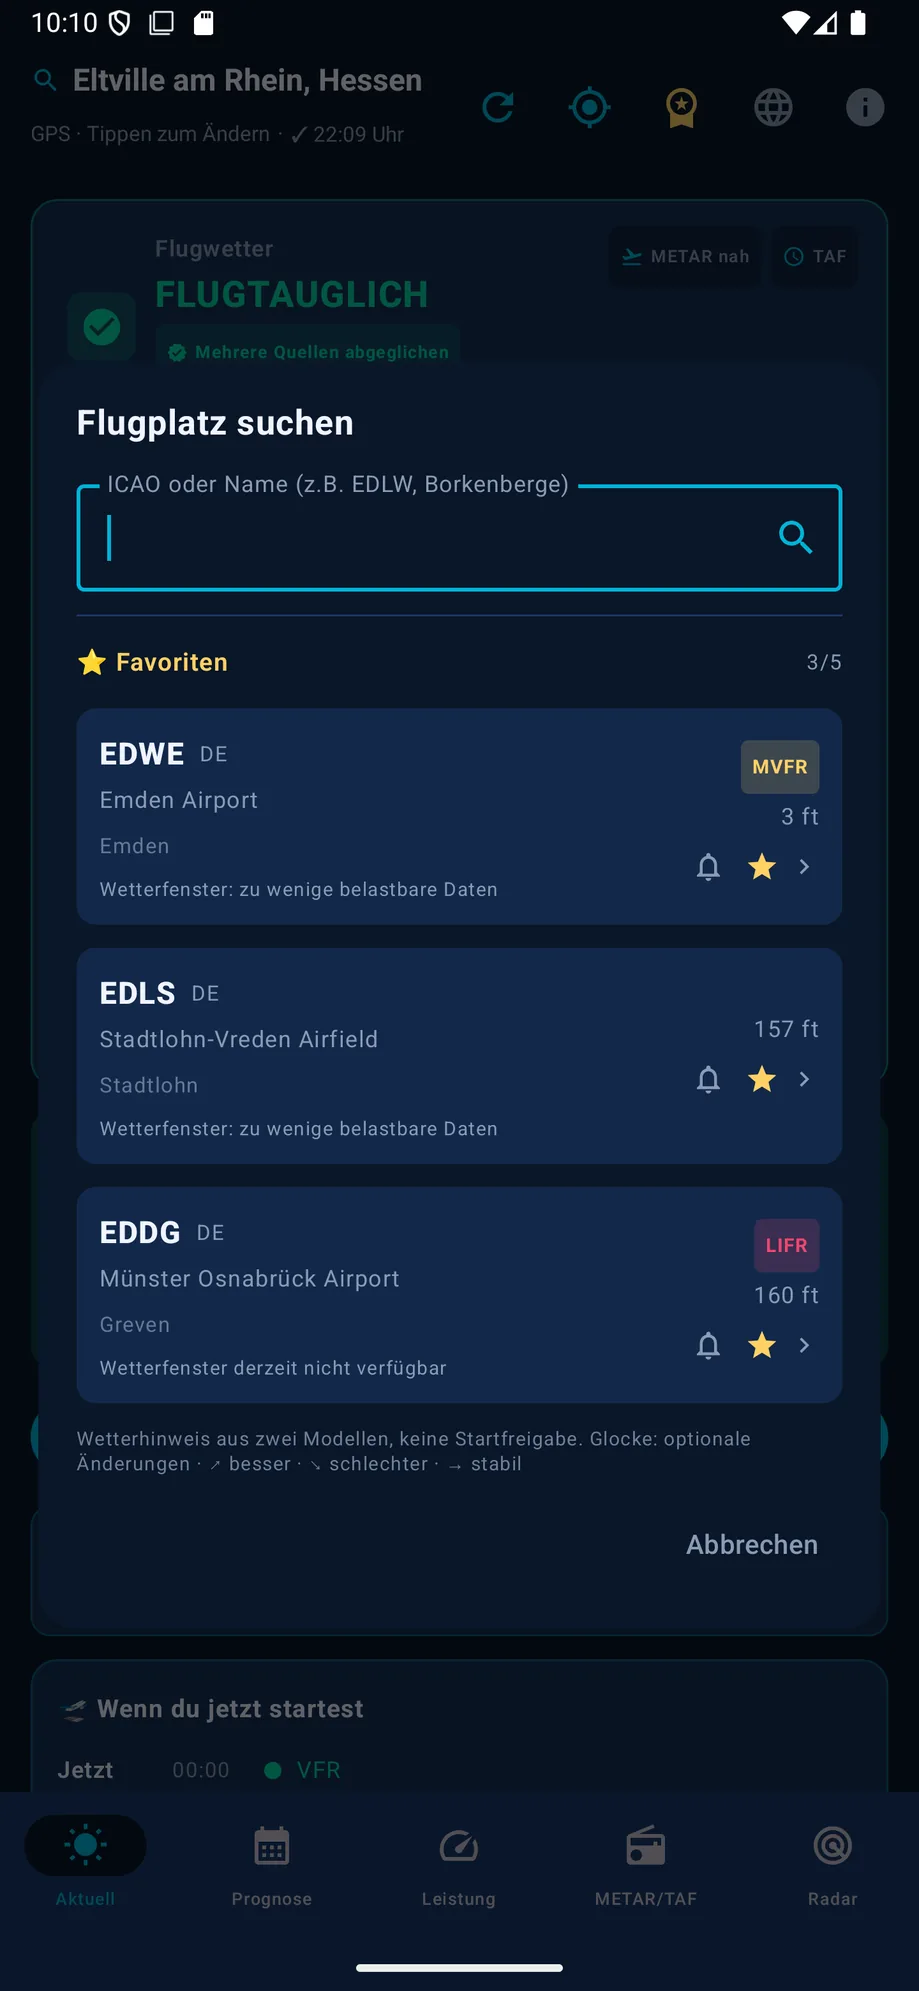
Search: ICAO code, airport name or city – across ~19,000 airports worldwide, fully searchable offline.

Save favorites: Saved airports show their live flight category (VFR/MVFR/IFR/LIFR) right in the search dialog – ideal for your regular airfields.

Flight-window hint: A conservative hint from the standard and regional model on when a window looks feasible (in the screenshot: "Weather window: not enough reliable data"). Optional, off-by-default change notifications per favorite – explicitly not a go-ahead to fly.

Favorites list in the search dialog with live flight category and weather-window hint

Forecast tab

Looking ahead – for planning flights over the coming days.

📅

Daily forecast

A go/no-go assessment for the day, based on Open-Meteo data and – where available – the matching regional model.

🕐

Hourly trend

A detailed hourly trend for the coming days, handy for picking the best departure window.

Cloud profile: a vertical cross-section of the sky

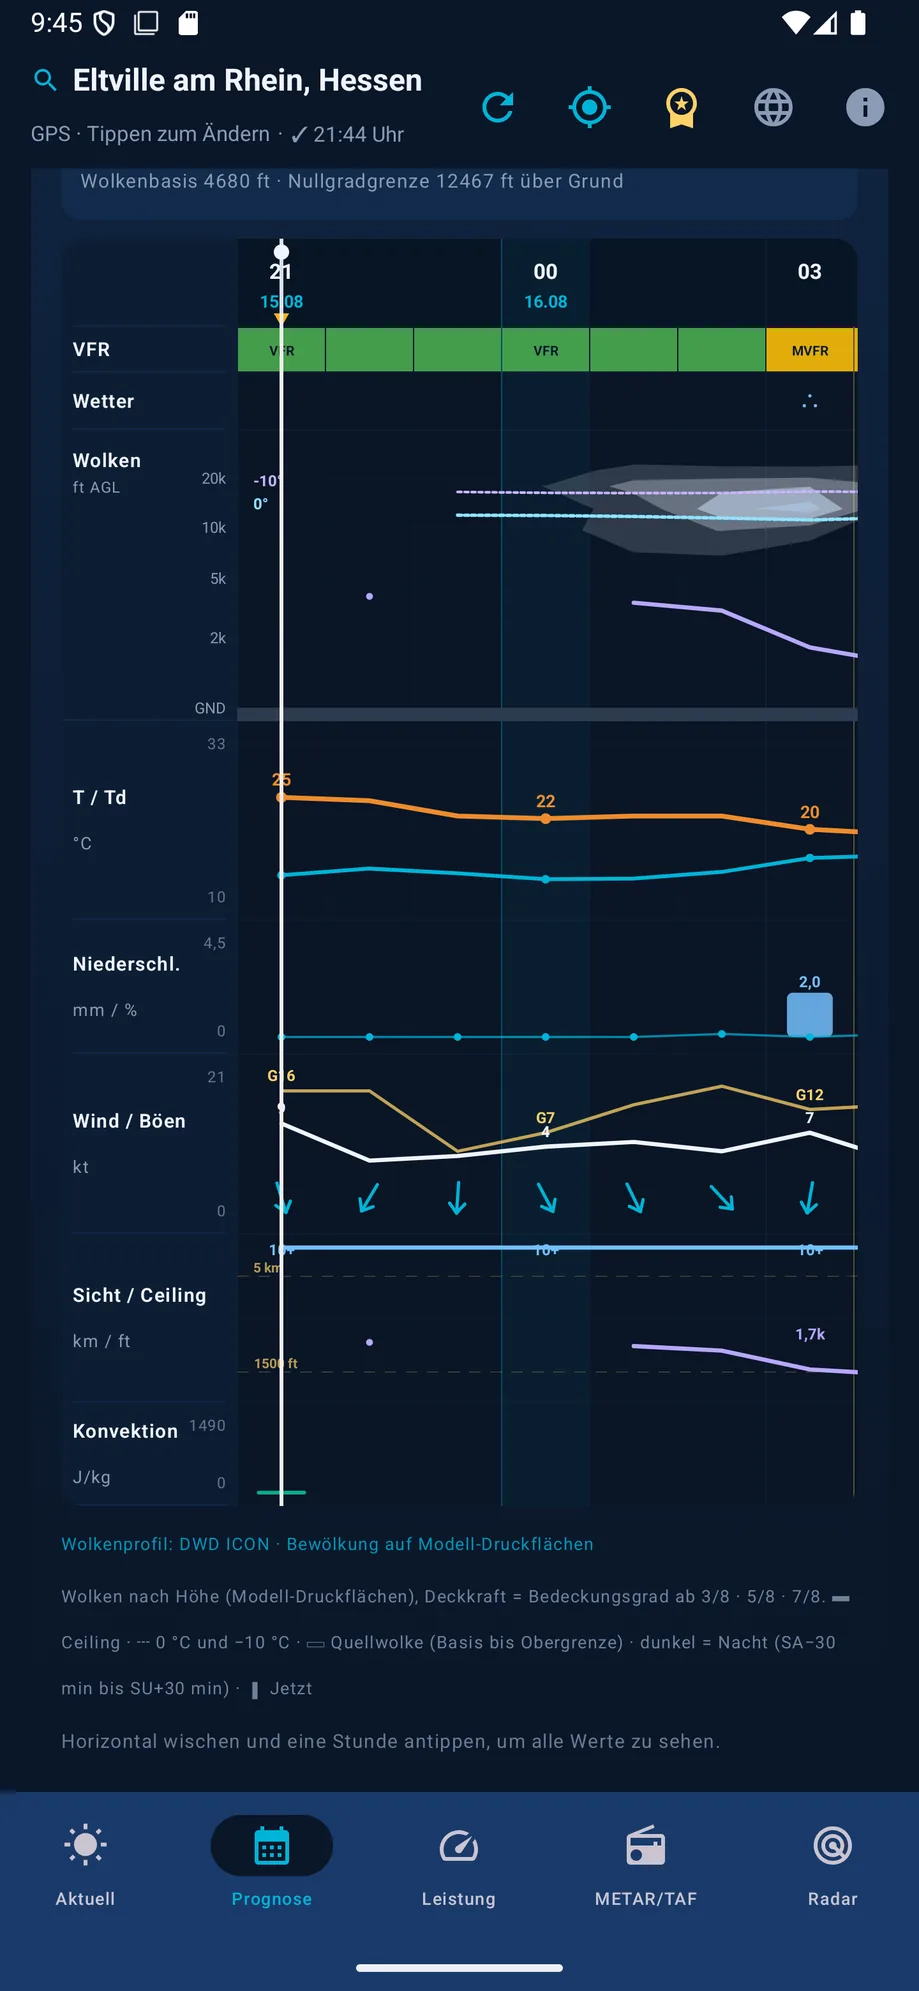
The meteogram shows a real vertical cross-section of the atmosphere instead of nominal cloud bands: low, mid and high cloud sit on a compressed altitude axis that gives the lowest 5,000 ft about half the panel, with opacity following the okta coverage boundaries (3/8, 5/8, 7/8). Cloud base is computed from the temperature/dew-point spread instead of starting at the ground, so the gap you could actually fly through becomes visible. Convective cells (towering cumulus) are drawn as their own base-to-top blocks, alongside ceiling and the 0 °C and −10 °C isotherms marking the icing window. A significant-weather row shows WMO symbols like an official chart, and night hours are shaded.

Data source: DWD ICON on eleven pressure levels. When the profile is unavailable, the display automatically falls back to nominal cloud bands.

Cloud profile in the meteogram: cloud by altitude, ceiling and icing window

METAR/TAF tab

Raw data in plain language, plus route planning with a hazard corridor.

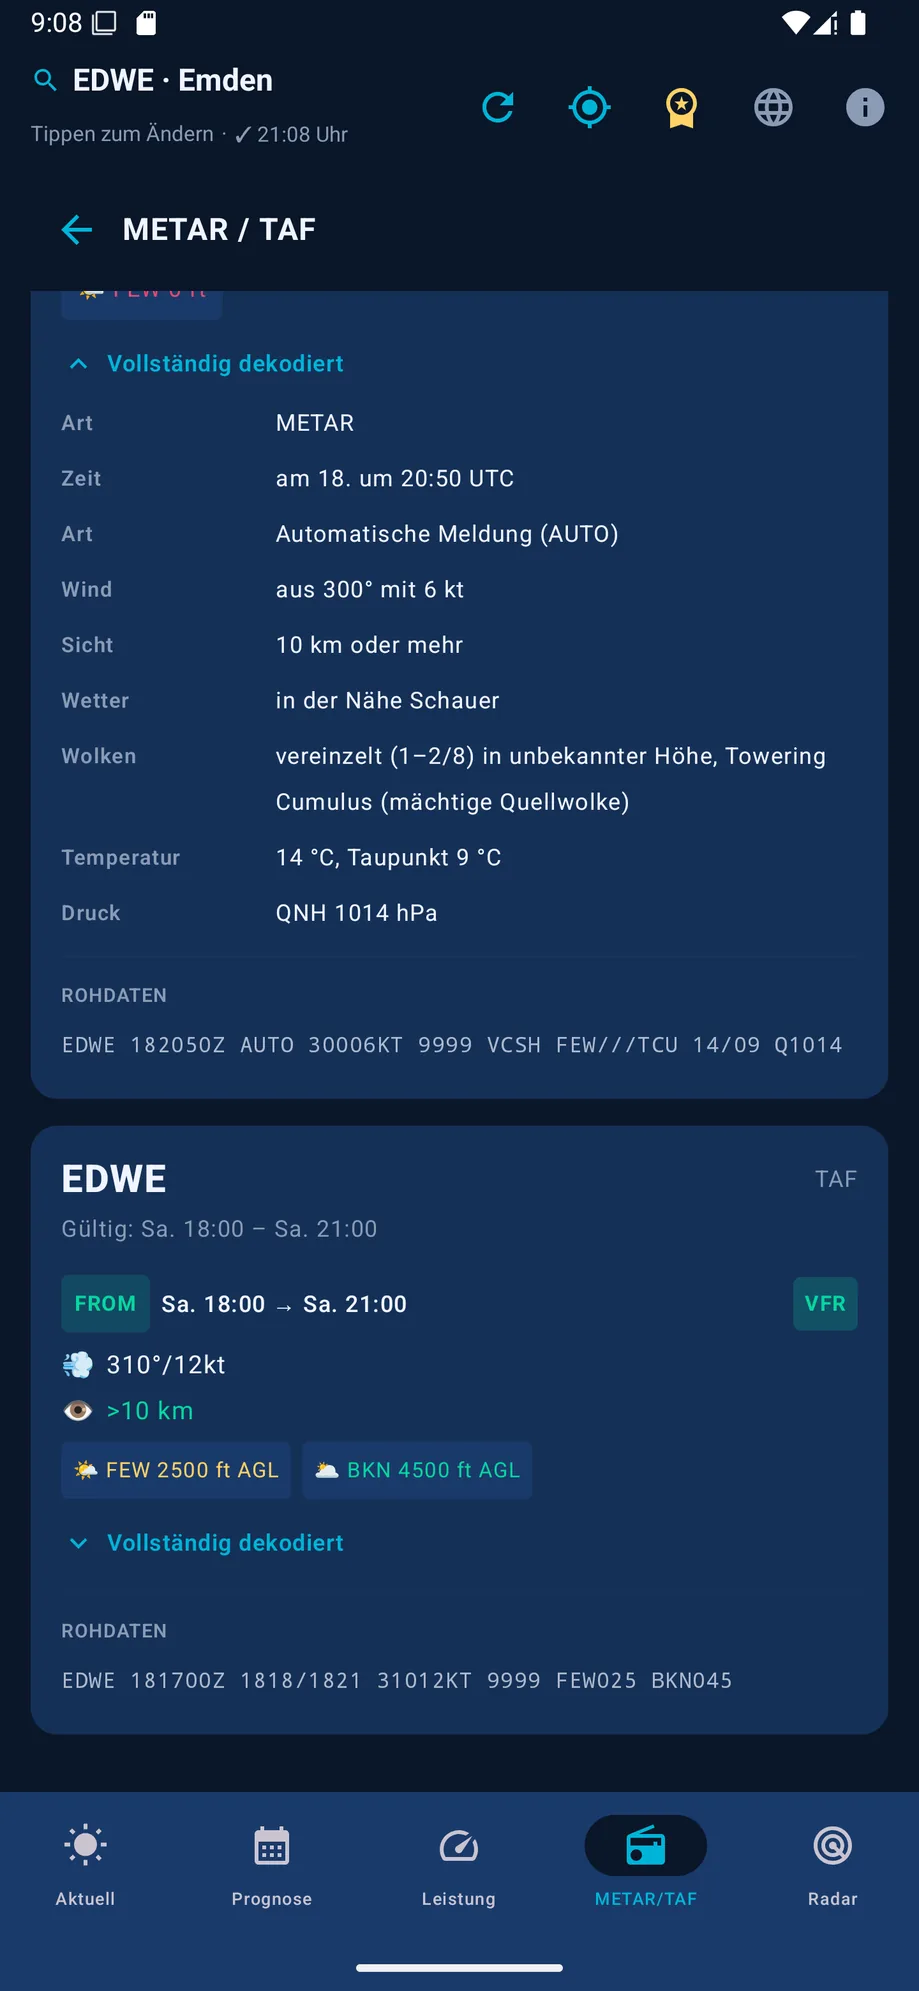
The full METAR/TAF decoder translates every group – wind incl. gusts, visibility, RVR, weather, clouds, QNH, trend – into plain, understandable language, including nearby stations if your airport has no METAR of its own.

Full METAR/TAF decoder
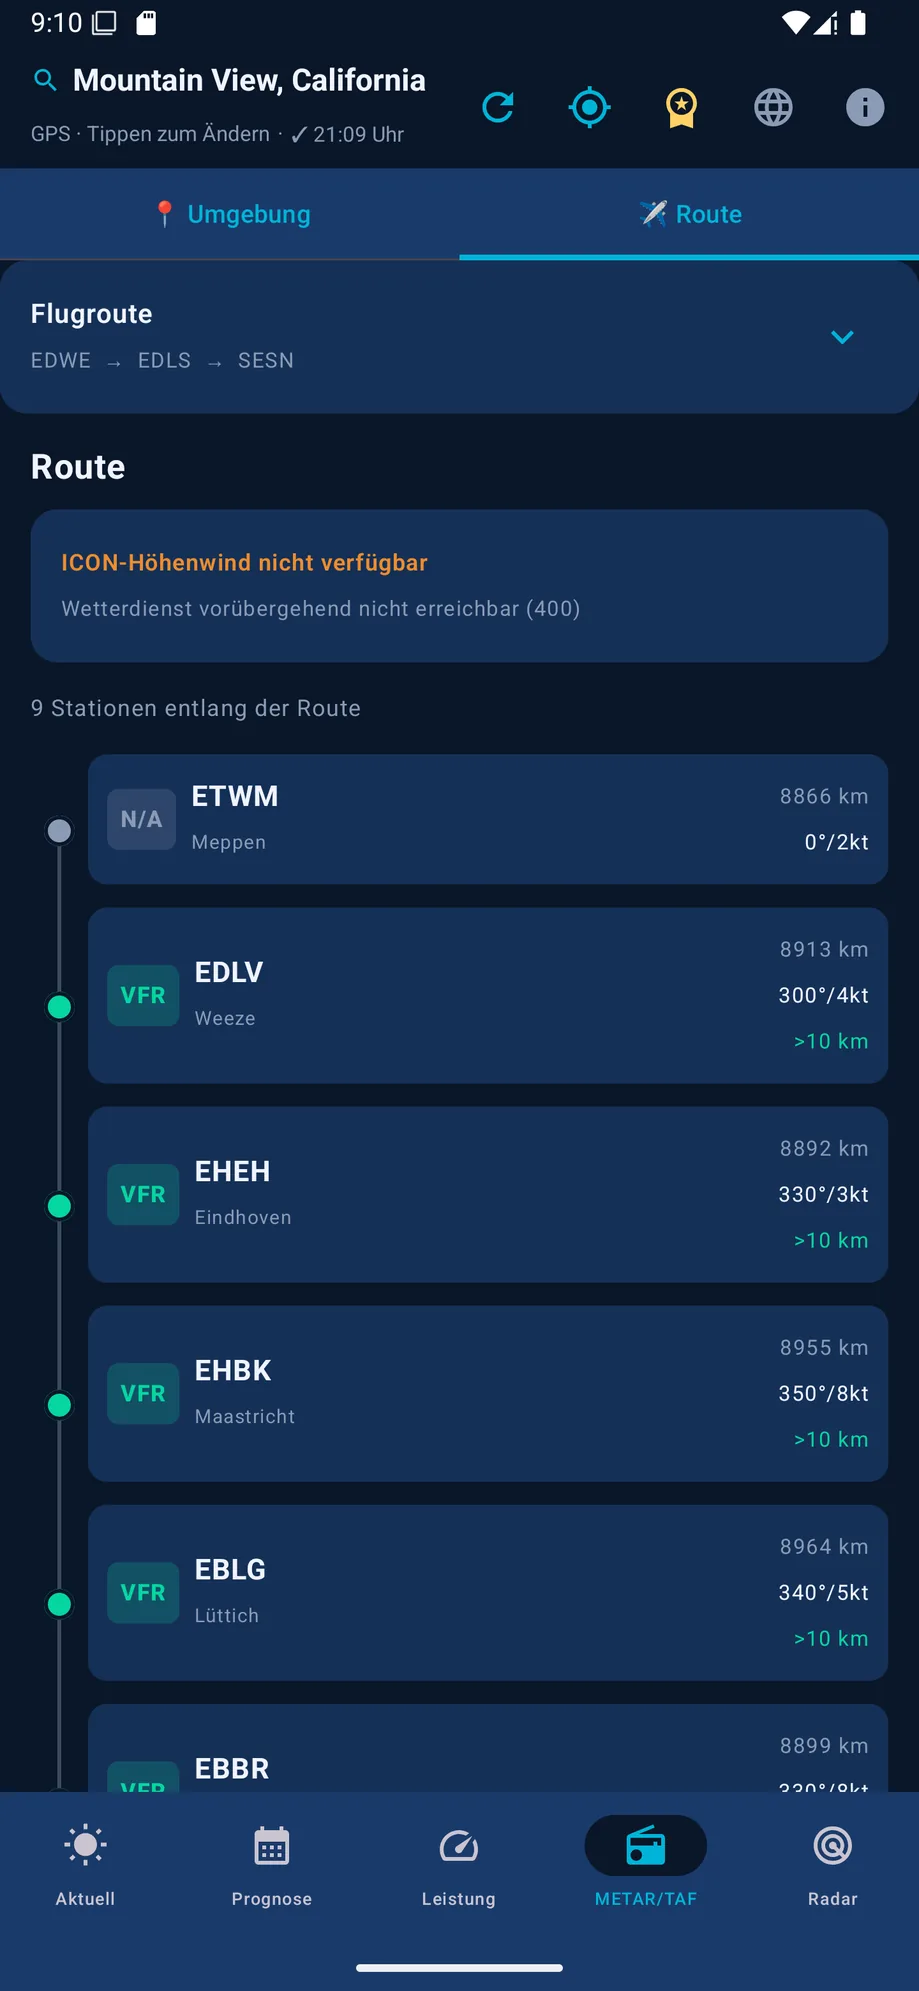
Route planner as a hazard corridor

Route planner as a hazard corridor

Choose a departure, destination and optional waypoints, plus a departure time (up to 72 hours ahead) and cruise speed. The app draws the route as a traffic-light timeline and marks every leg green, yellow or red – based on upper winds, official warning polygons matched to the calculated passage time, TAF change groups and precipitation radar at the route point.

Every evaluation is also stored as an offline package for up to 7 days in case you lose connection en route – with a visible age and expiry notice.

Performance tab

Density altitude and crosswind before you taxi to the runway.

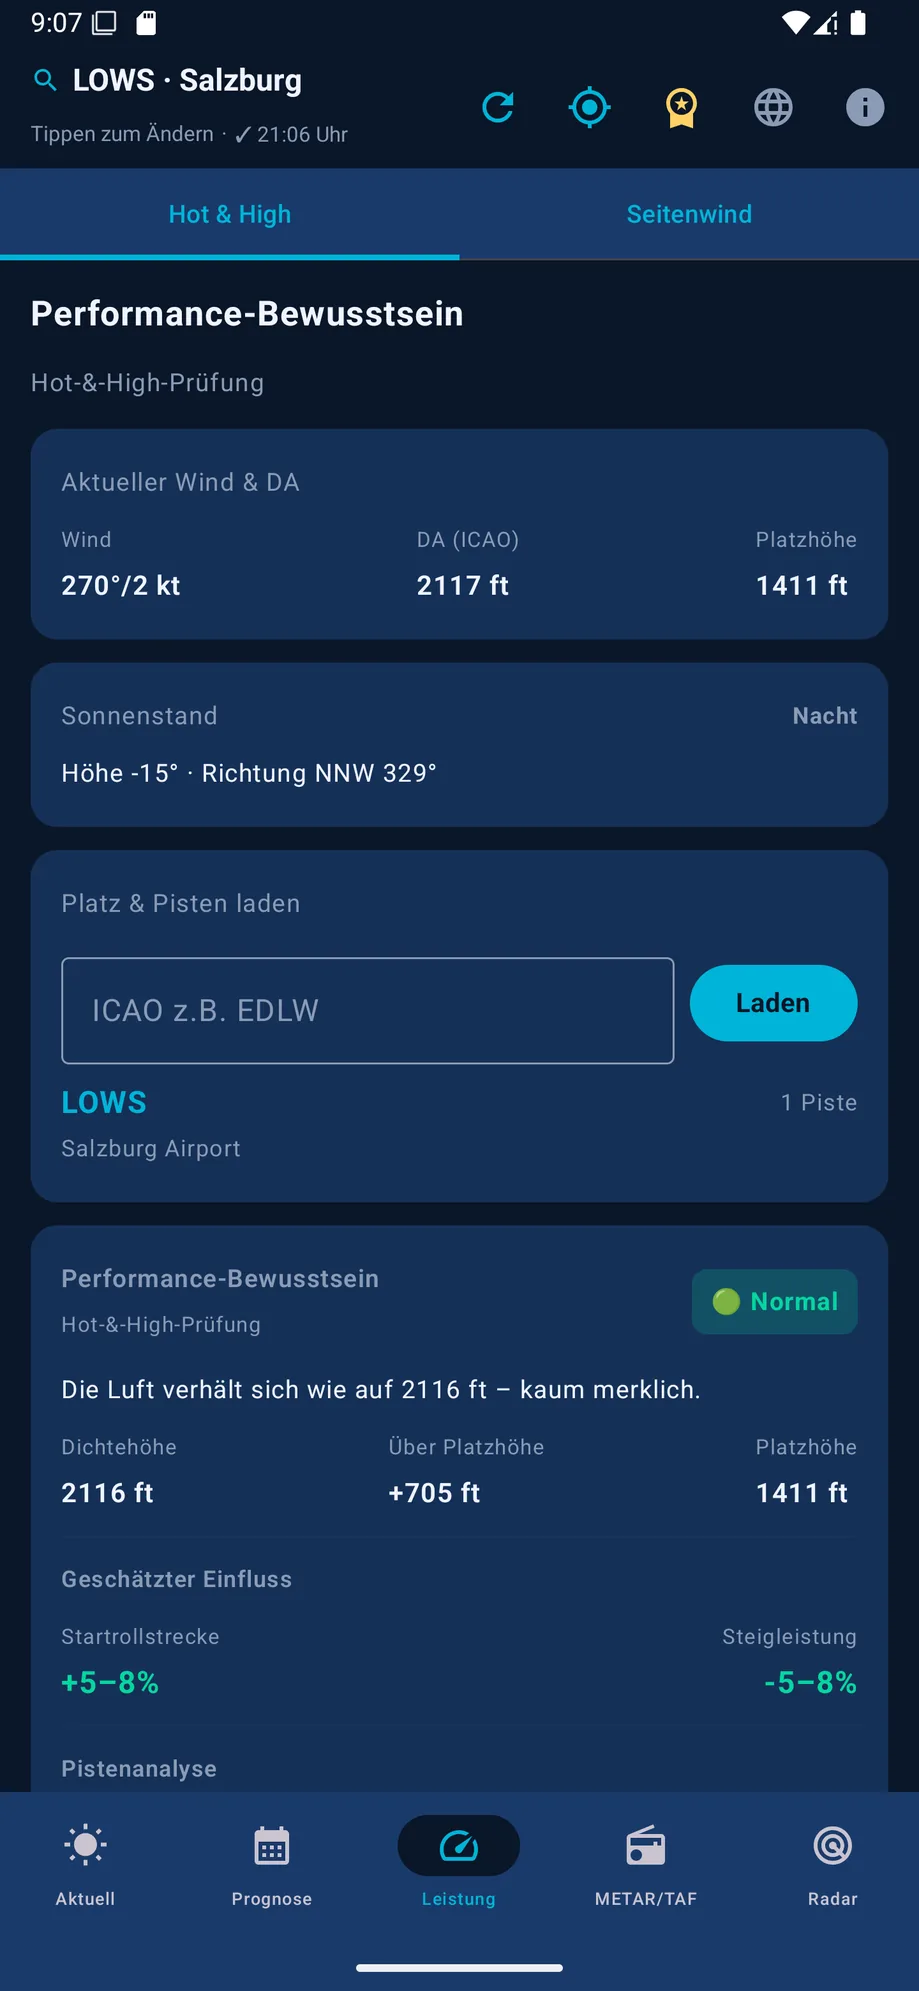
Density altitude, pressure altitude, ISA deviation and humidity for a realistic sense of takeoff and climb performance – a tool, not a replacement for POH calculations. For the rule-of-thumb math behind it, see Calculating Density Altitude.

Performance tab with density altitude
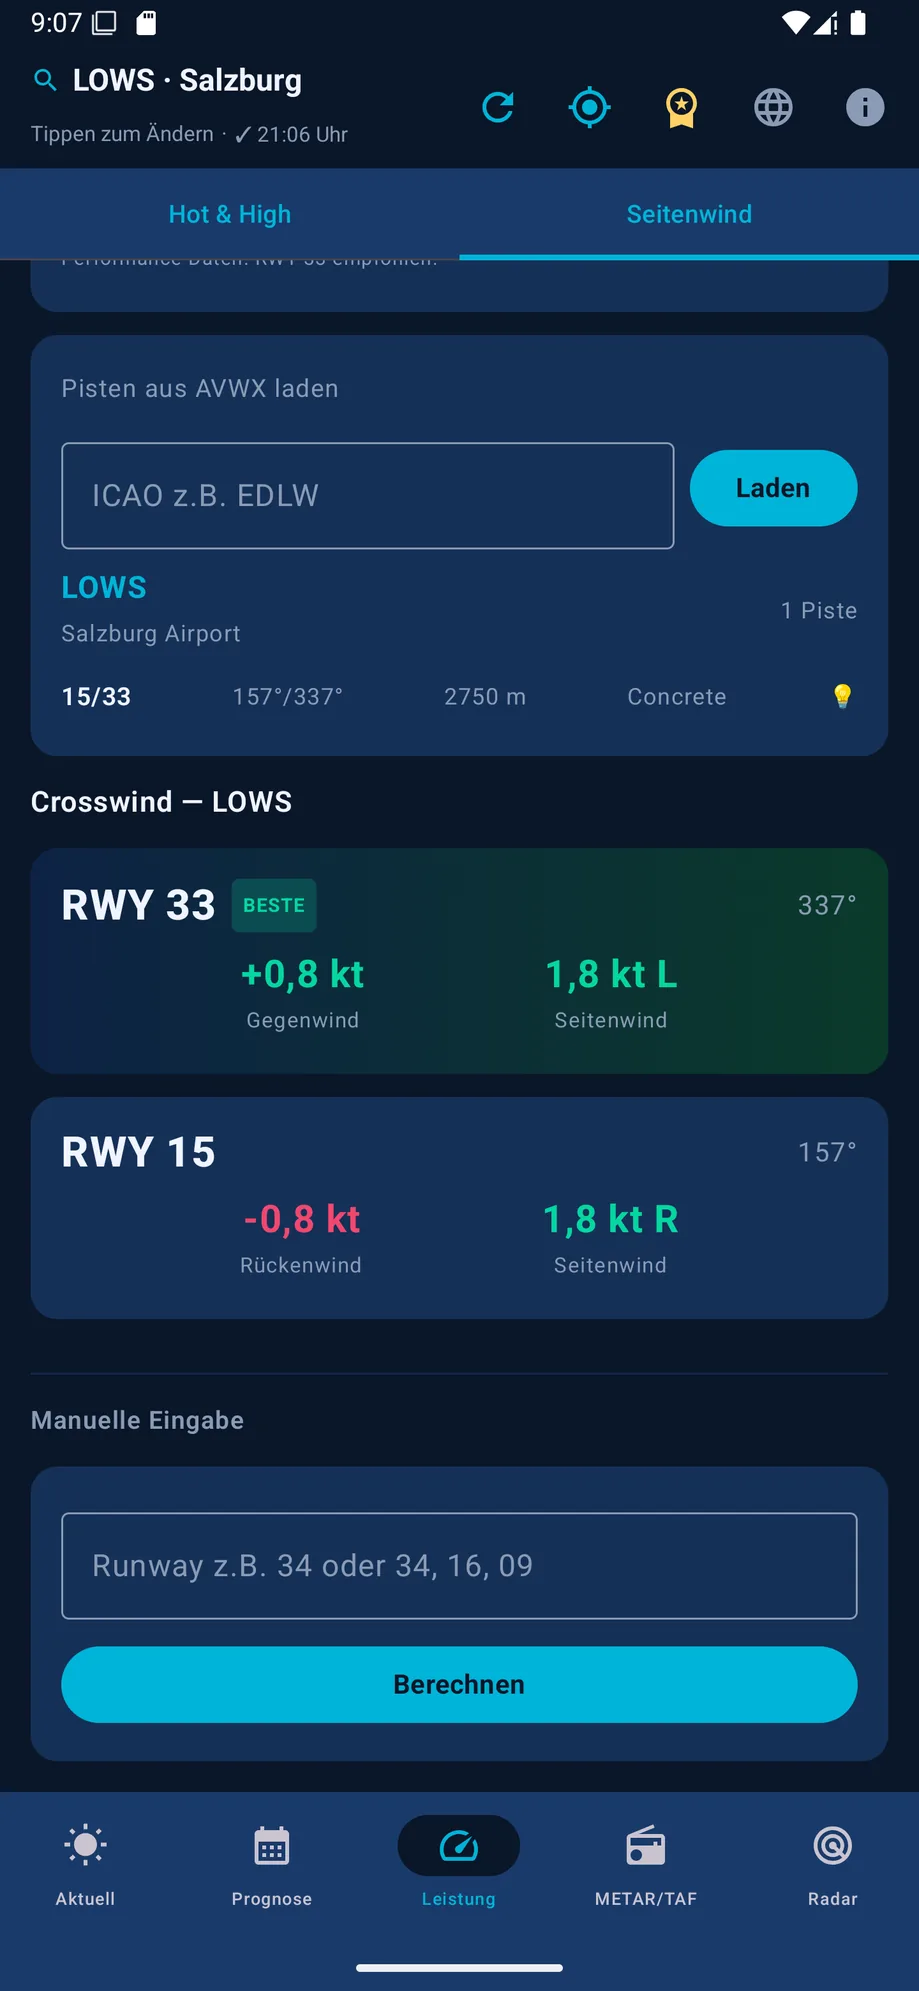
Crosswind calculator with runway recommendation

Crosswind calculator

Load runway data or enter wind direction/speed manually – the app shows the crosswind and tailwind component per runway heading and recommends the most favorable one. The formula and rule of thumb behind it are in Calculating Crosswind.

Radar tab: 5 map layers

Everything visual in one place, with a shared time slider.

🌧️

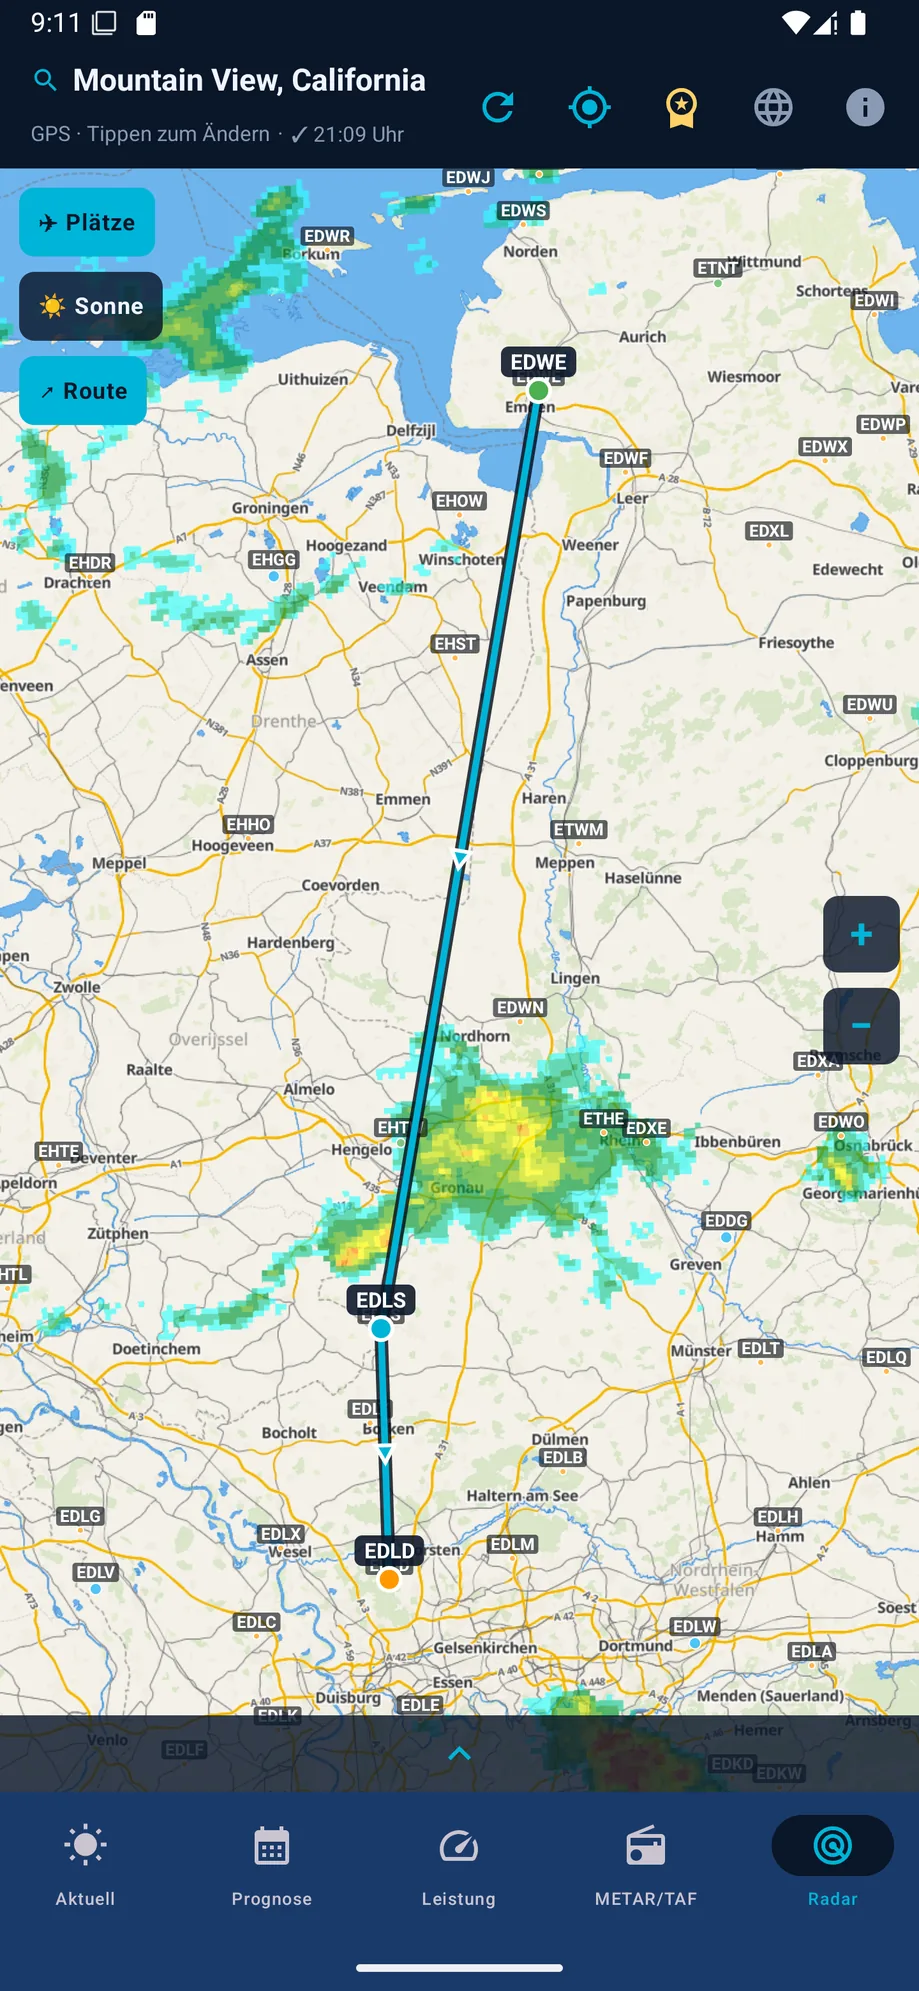
DWD radar + lightning

Official RADVOR nowcast up to +2 hours, plus current lightning detection.

🛰️

Satellite & Europe radar

EUMETSAT GeoColour satellite imagery and Europe-wide EUMETNET OPERA radar observations, each with 2 hours of history.

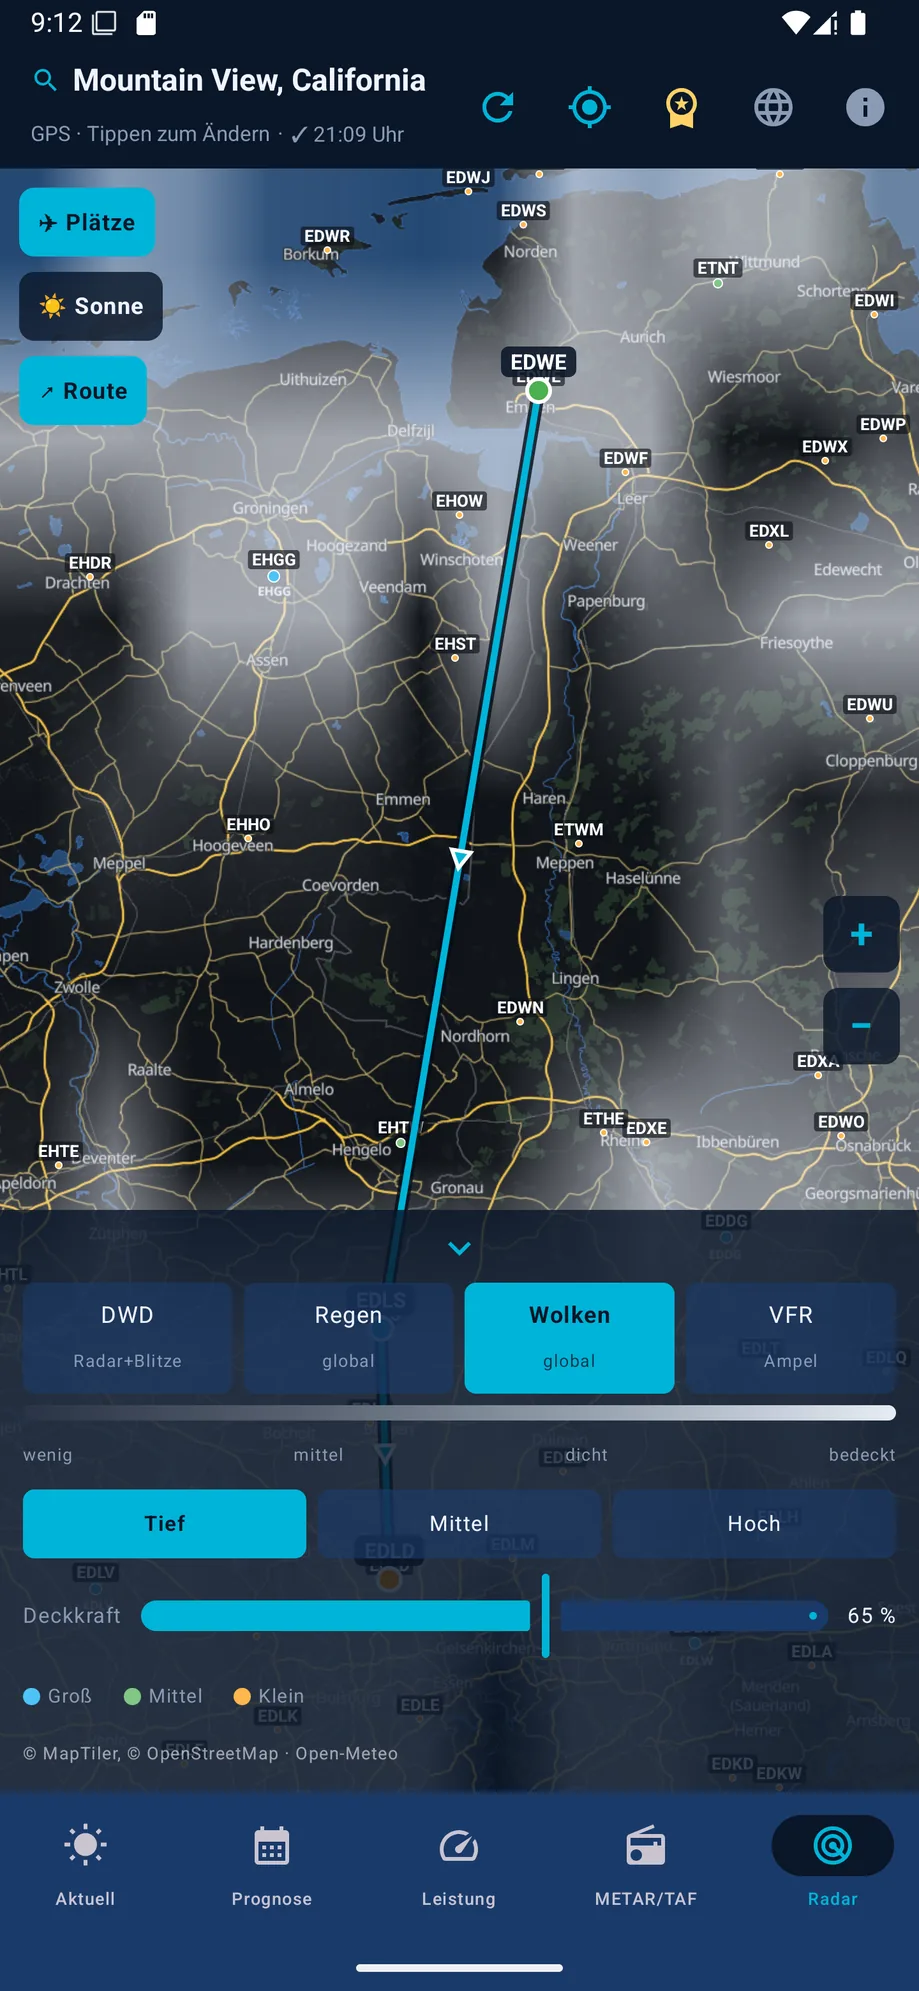
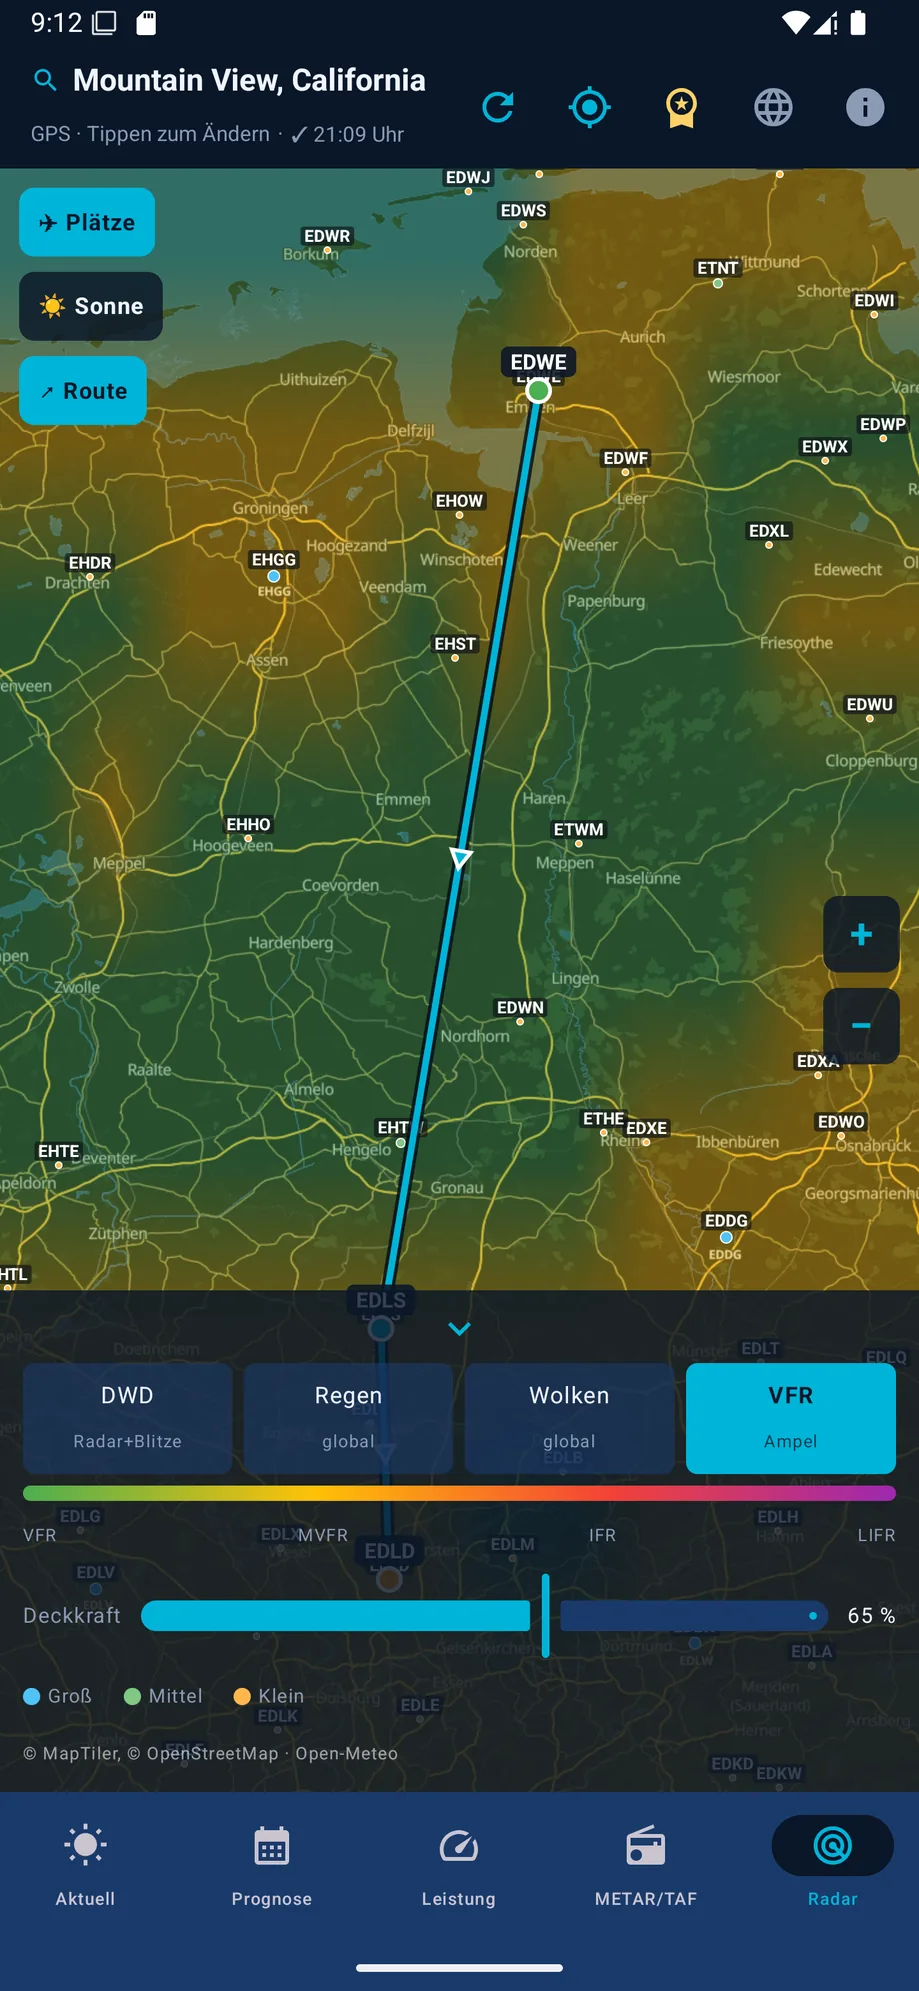
☁️

Clouds & VFR heatmap

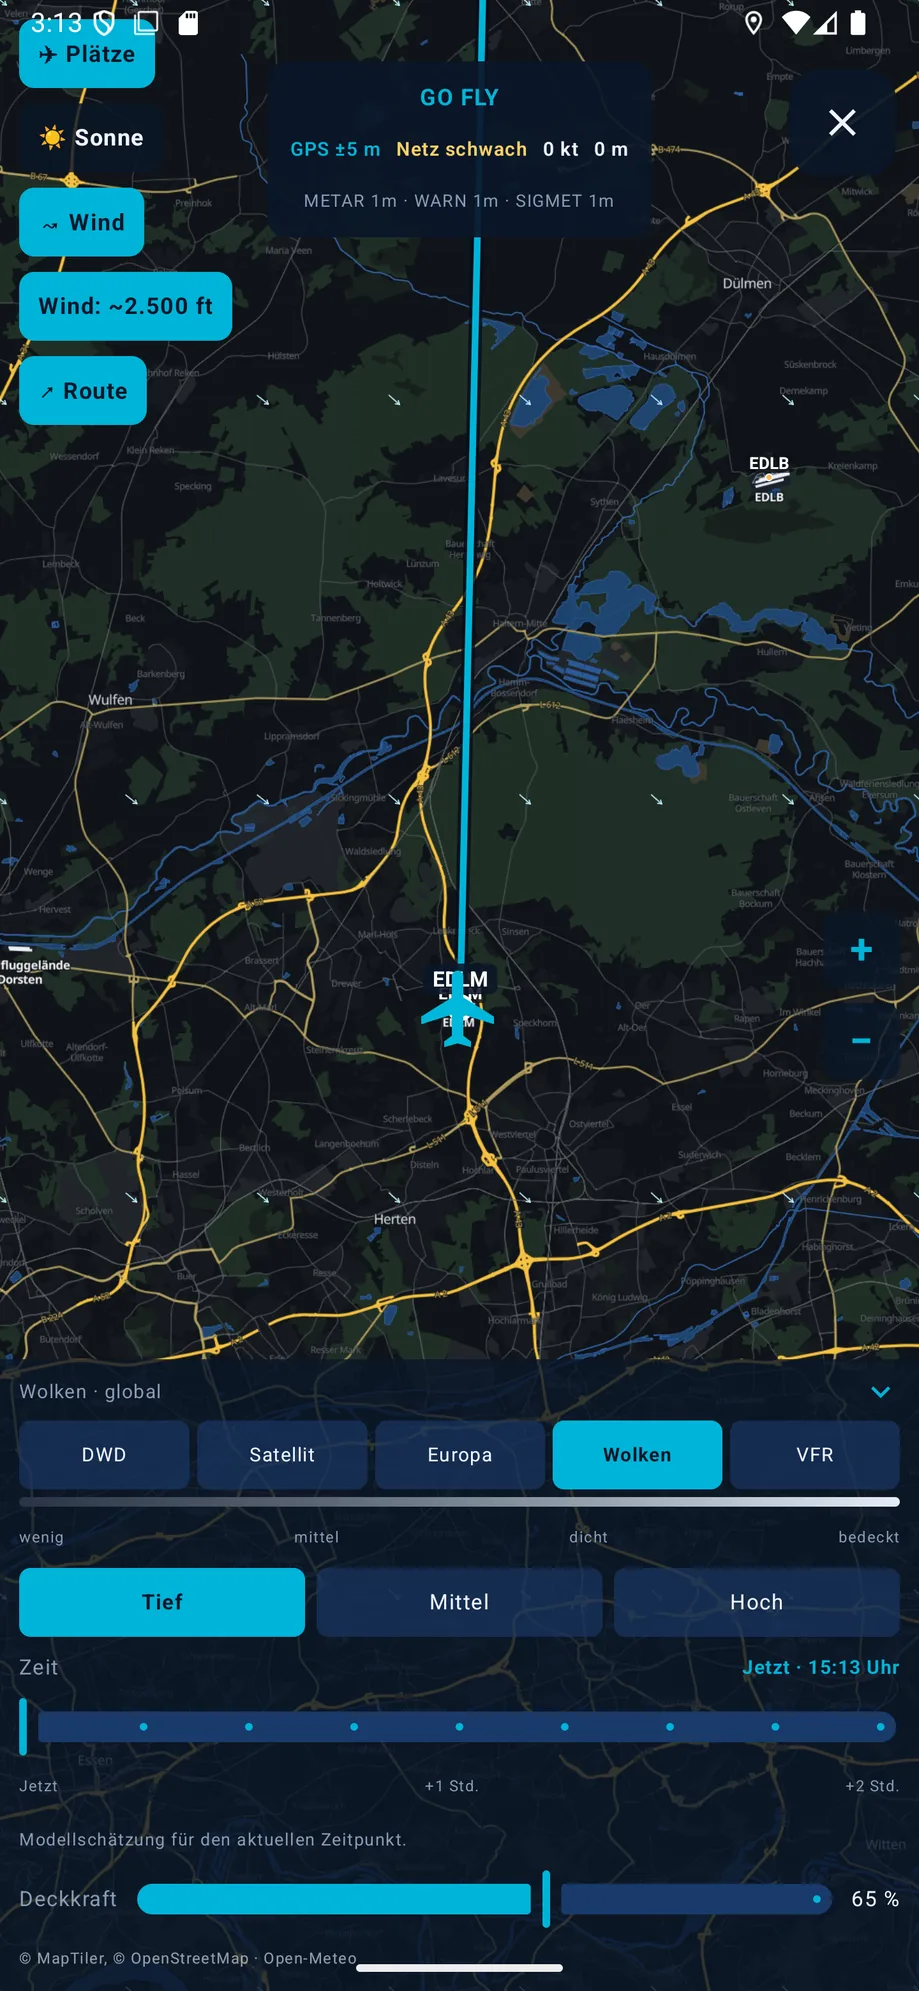
A self-rendered Open-Meteo cloud field plus a traffic-light heatmap by flight category – both with an hourly model forecast.

DWD rain radar with flight route on the map
Cloud layer on the map
VFR traffic-light heatmap on the map

Airports can be toggled on as points, and a route chosen in the METAR/TAF tab is shown over all layers.

Go Fly: live moving map

For during the flight itself – not just for preparation.

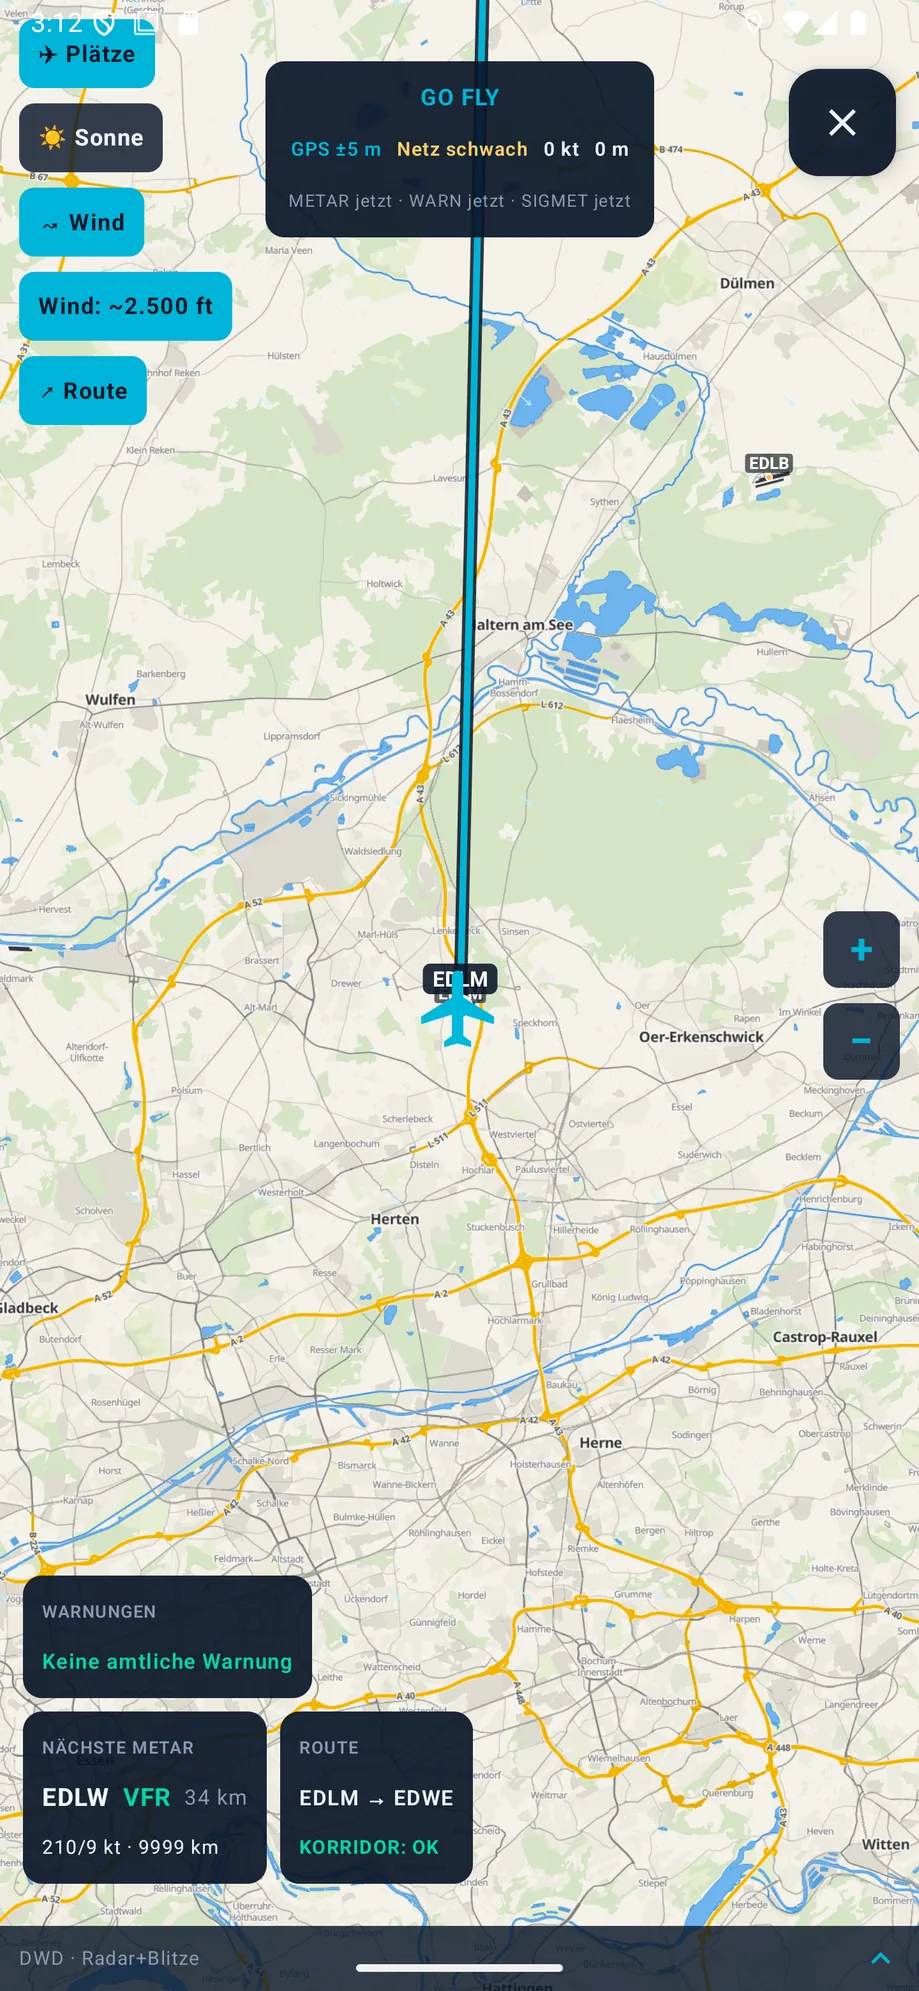
In Go Fly mode the app shows your real GPS position on the same weather map. A route previously chosen in the route planner stays visible only as orientation – it never replaces the GPS position. A compact field shows the overall corridor verdict as OK, Check or No Go, plus the nearest METAR station within 40 km, continuously updated.

Go Fly live moving map with GPS position and route corridor
Animated wind field over the weather map

Animated wind field

Both the radar and Go Fly views let you toggle on an animated wind field: surface wind plus two model pressure levels (~2,500 and ~5,000 ft). The ft values are deliberately approximations only, not altitude-resolved flight wind.

🧵

Track trail & forward projection

Your flown path for the current session stays visible as a trail on the map; at a stable course and speed the app projects the next 10 minutes ahead.

⚠️

Warnings & SIGMET

Current official weather warnings and SIGMET polygons are shown directly on the map – from a local cache of recent positions, even through a brief loss of connectivity. For how SIGMET differs from AIRMET and GAMET, see SIGMET, AIRMET & GAMET explained.

🛬

Diversion-airport row

The nearest airports from the local database, colored by their assigned METAR station's weather and distance – for a quick diversion decision in flight.

Share your briefing as a PDF

Assessment, values and route as a document – for yourself or to pass on.

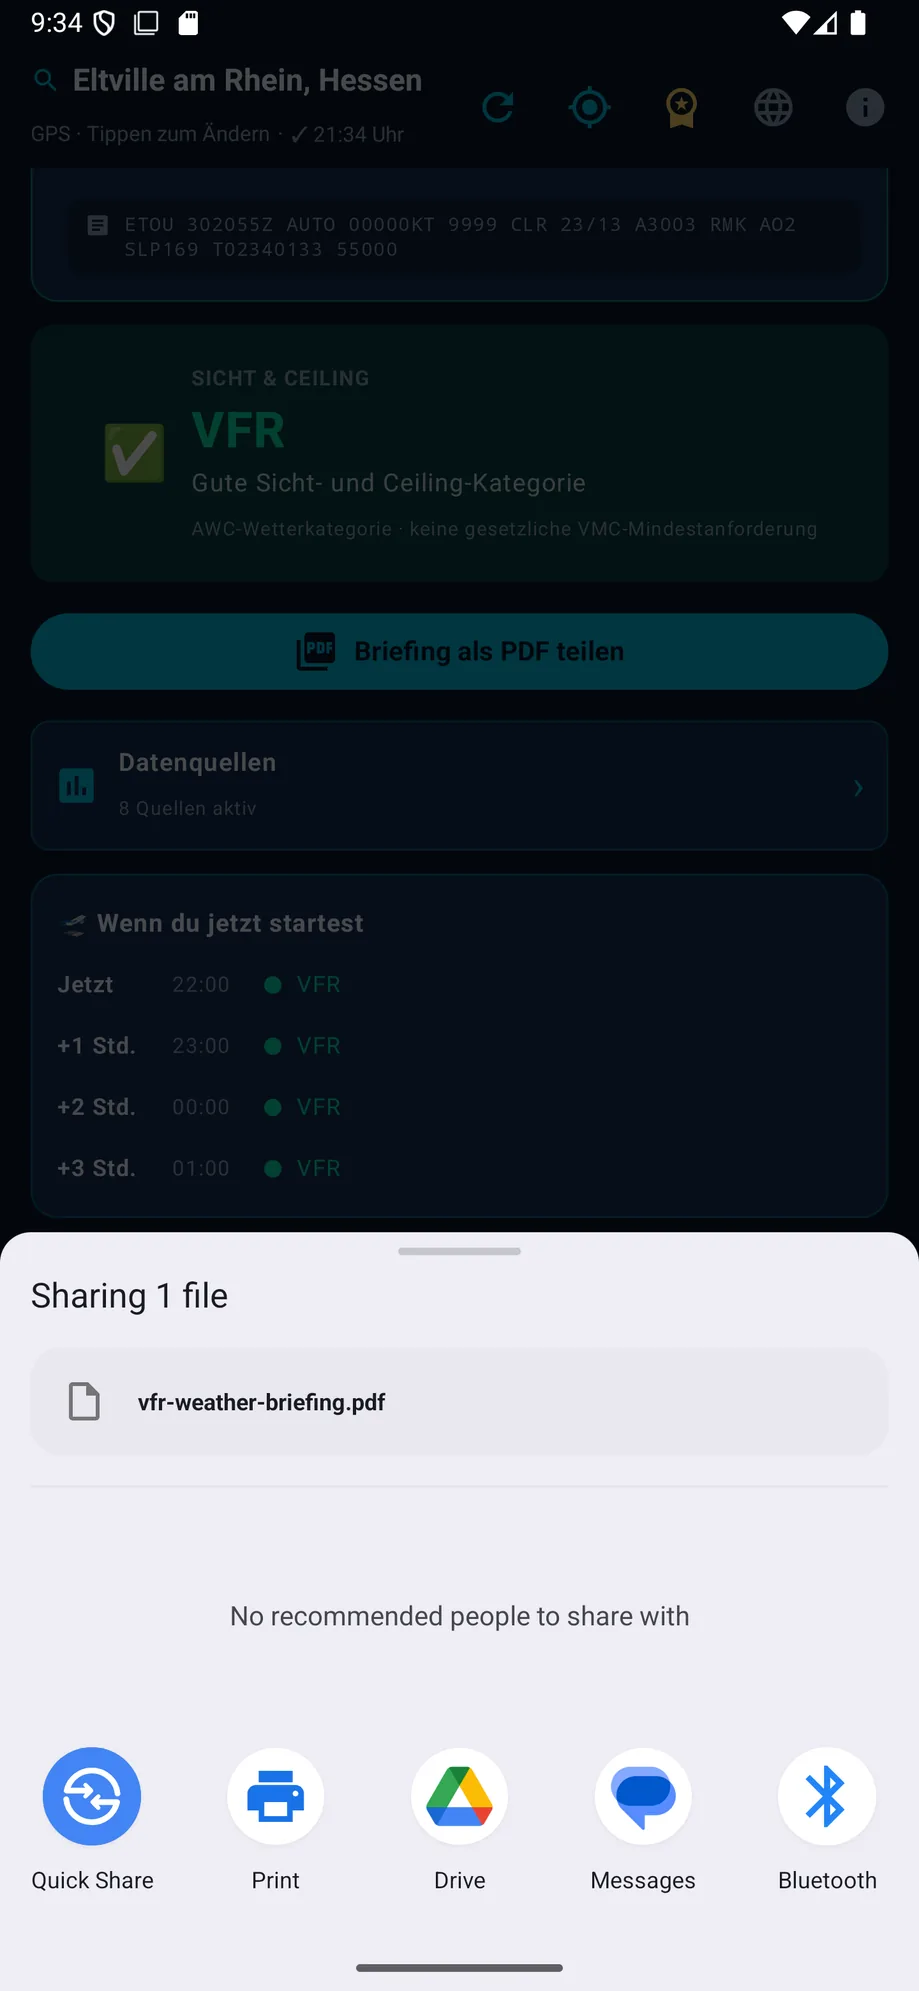
Without an active route, "Share weather briefing as PDF" in the Current tab builds a PDF from data already loaded: assessment, current observed and model values, reasoning, official warnings, hourly trend and forecast days. After a successful route evaluation, "Share route briefing as PDF" appears instead, directly under the route result, adding its most critical leg. Both paths use the same export – no additional requests are triggered.

The document is marked as a snapshot: the data timestamp and an expiry time (60 minutes after that timestamp) stay visible unchanged even after forwarding. Every page states that it is not an official flight weather briefing and not a go-ahead to fly, plus a discreet mention of VFR Wetter and vfrwetter.com. The last page also carries a QR code linking to the Google Play listing.

Sharing the briefing PDF via Android's share function
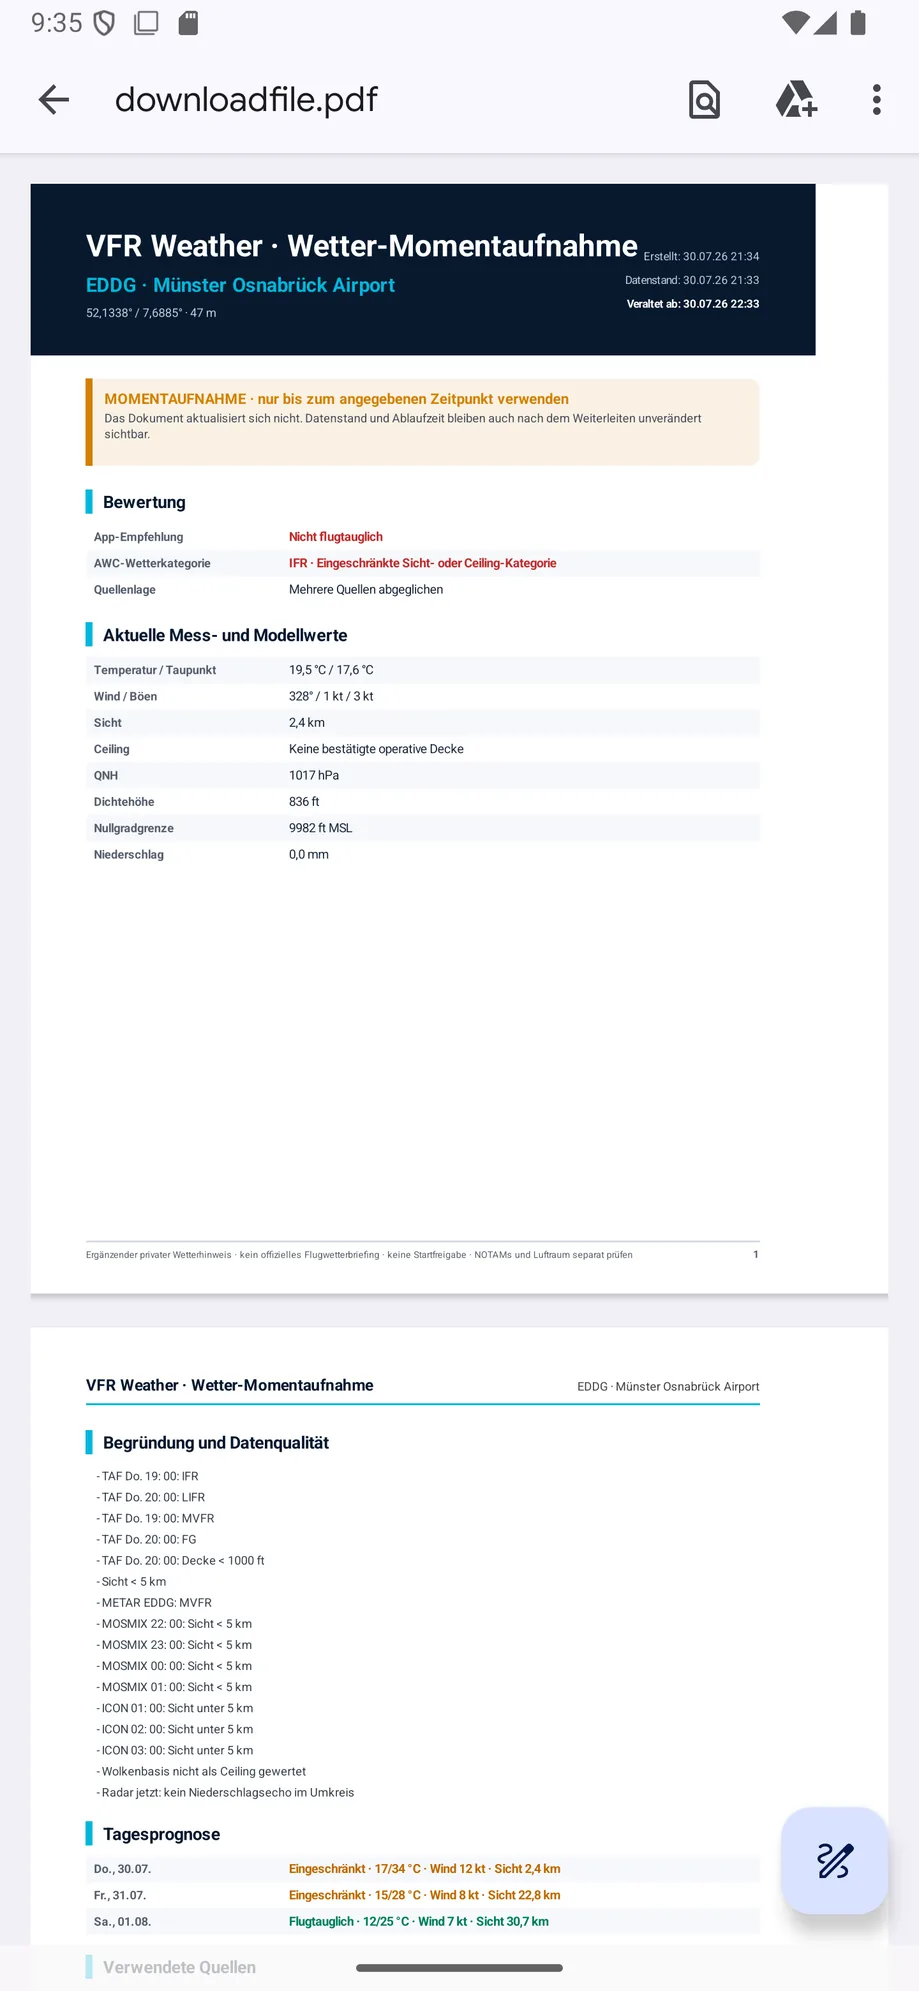
Example page of the VFR Wetter briefing PDF

What's in the PDF

The app's recommendation and AWC weather category, current observed and model values (temperature, wind, visibility, QNH, density altitude, freezing level, precipitation), the reasoning with data quality, and the daily forecast with its data confidence – compact on one page, with a disclaimer footer.

With an active route, a VFR corridor map is added to the document: a grid by flight category (VFR/MVFR/IFR/LIFR) with the route and per-leg risk points. If the route runs through Germany's radar coverage, a real DWD radar image of the same map extent is layered underneath – including source attribution and a snapshot notice.

Data source status

See at a glance what the current assessment is really based on.

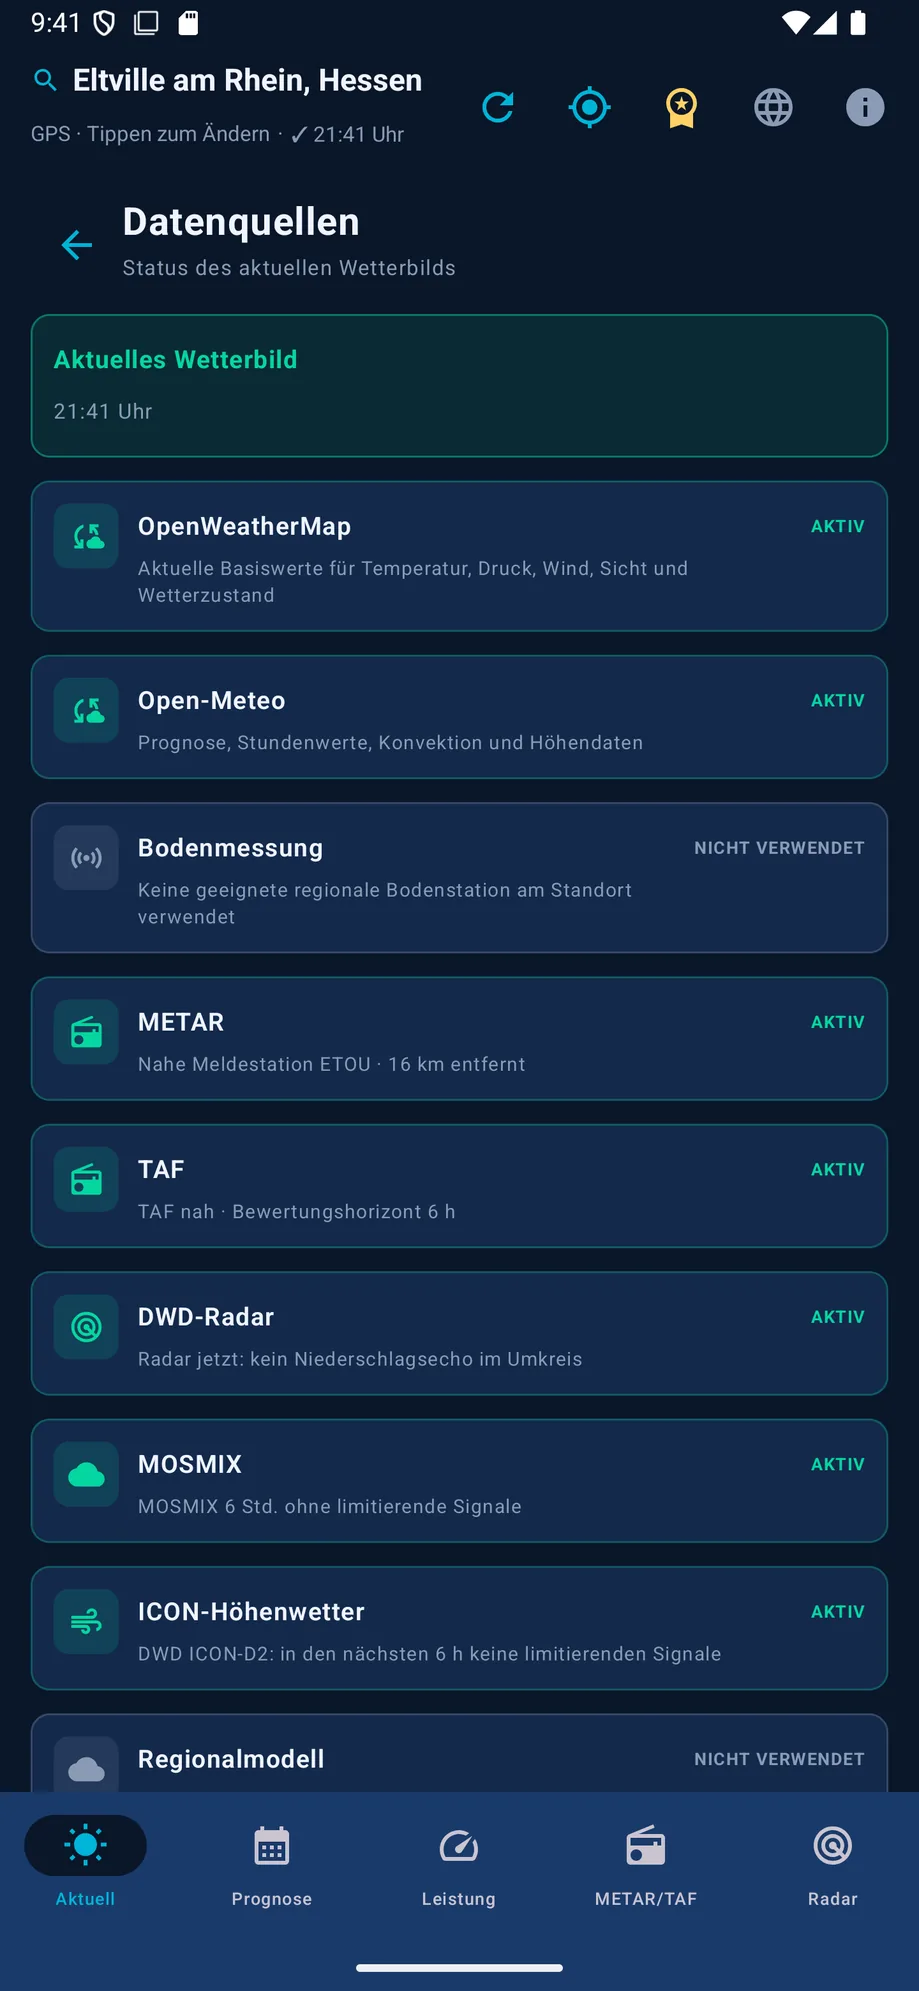
The status page in the Current tab reads the same, already-loaded data snapshot – no extra network requests – and lists every possible source individually: active, not used (e.g. because no suitable ground station or regional model exists at this location), or as a reported outage. So you can see transparently whether, say, a nearby METAR, TAF, DWD radar or MOSMIX actually fed into the current assessment.

Data source status page with active sources

Set up the homescreen widget

The key values, without opening the app.

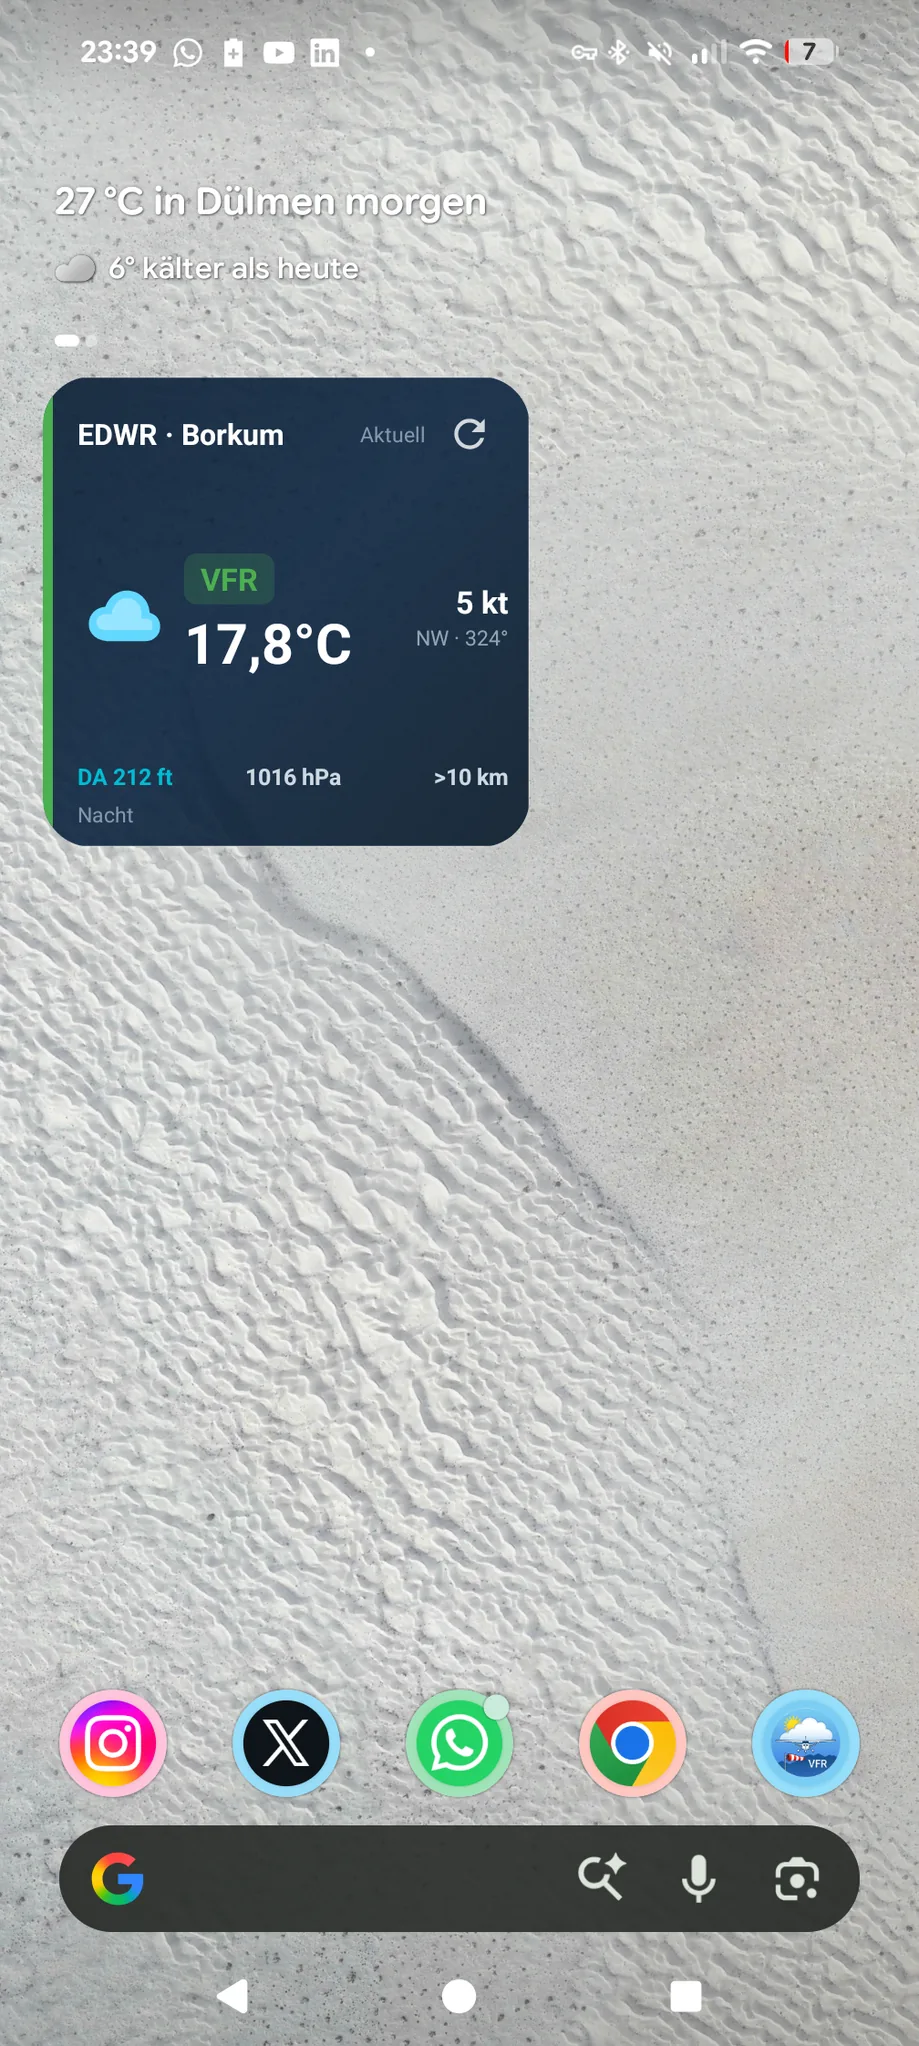
The widget can be dragged onto the homescreen like any Android widget and adapts to compact, standard or expanded layout depending on the available size. It shows the VFR category, temperature, wind, density altitude, QNH, visibility and an active DWD warning. Tapping the refresh button updates the data manually without opening the app; if the data is older than 60 minutes, the widget makes that visible.

VFR Wetter widget on the Android homescreen

Switch language

System language, German or English – switchable anytime.

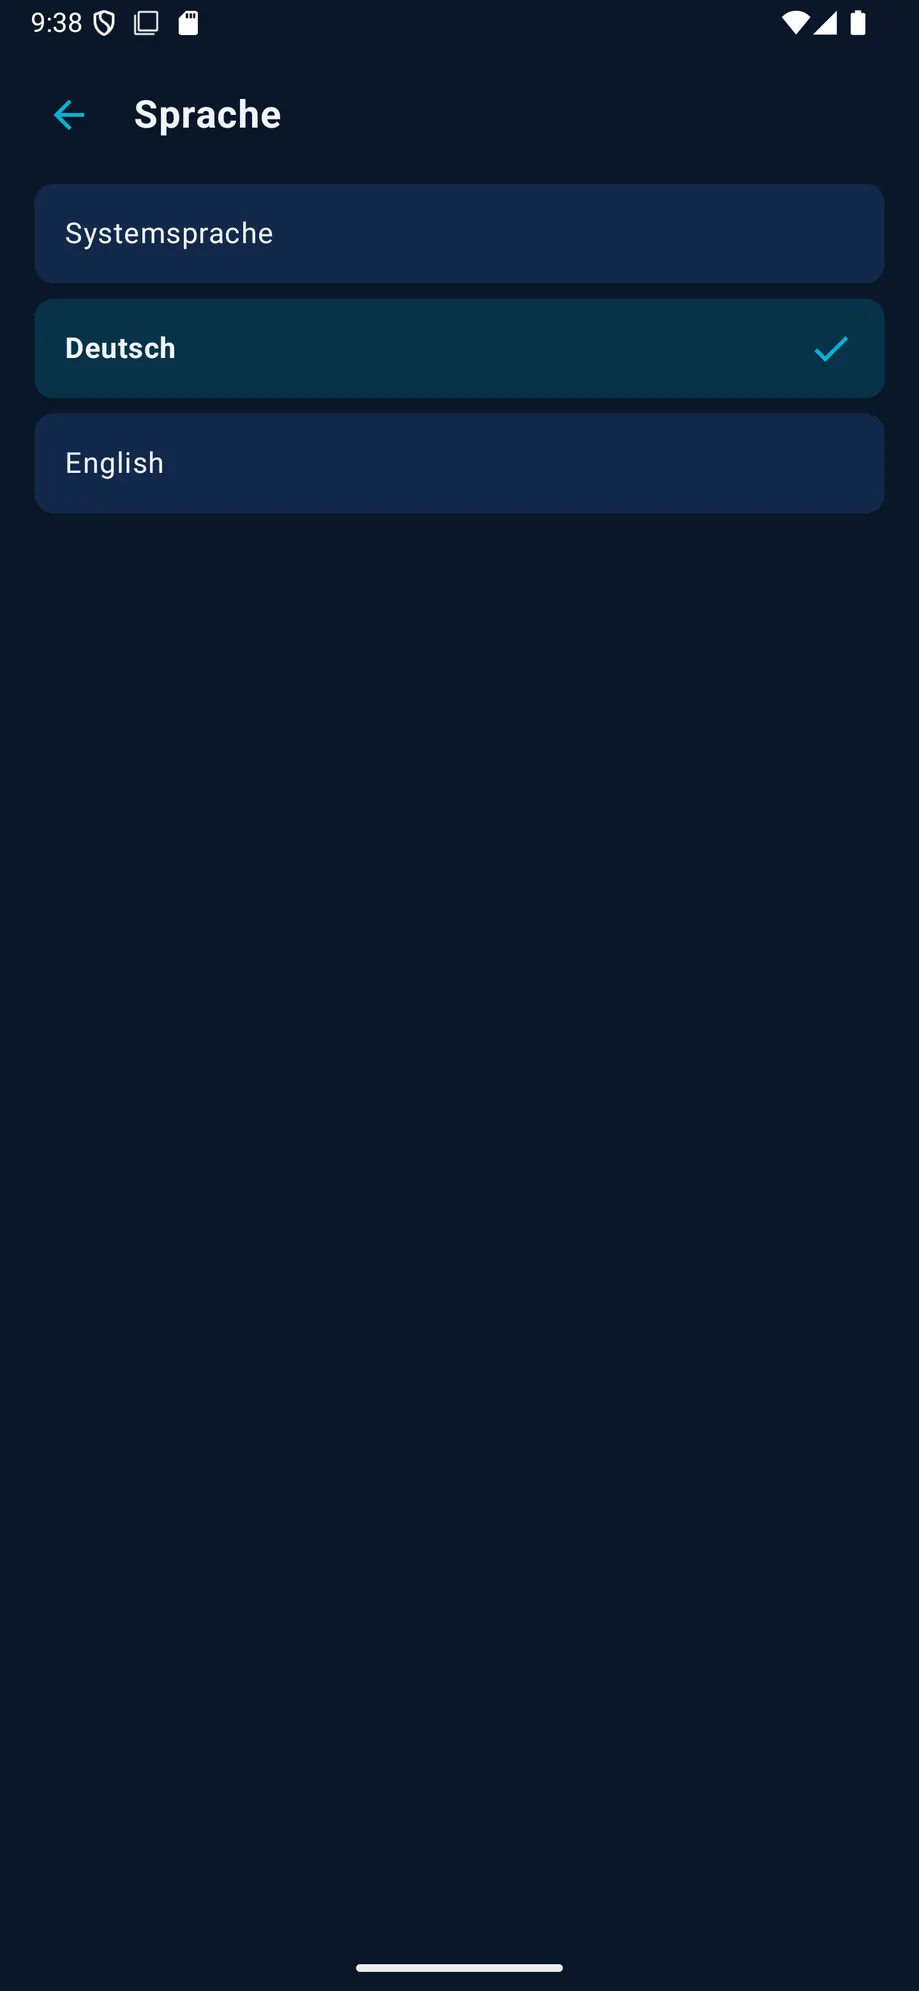
The language icon in the top bar opens the switcher dialog. UI, professional assessments, the widget, error messages and METAR/TAF plain text all switch together with the chosen language; raw flight weather reports, ICAO codes and proper names deliberately stay unchanged. Switching language restarts the app.

Language switcher dialog: system language, German, English

Manage your subscription

Short and transparent: trial, price, cancellation.

🎁

7 days free

After the disclaimer, the trial starts automatically, with no feature restrictions.

🔁

Then subscription

VFR Wetter Pro continues via Google Play Billing. You'll see the current price in the Play Store.

Cancel anytime

Directly in the Google Play Store under "Subscriptions" – also shows your next billing date and current price.

Using it offline

What still works when you have no connection.

📦

Weather cache

The most recently loaded data stays visible locally; past 60 minutes the app clearly warns about stale values.

🛫

Offline route packages

Your last route evaluation stays available as an offline package for up to 7 days, with a visible age and expiry notice.

🔍

Airport search

Search across ~19,000 airports works fully offline, with no connection at all.

Questions about specific features

Details from this guide, summarized.

What does the "OK", "Check" or "No Go" corridor verdict mean in Go Fly?

It summarizes how your previously planned route currently looks along your actual flight path. It never replaces your real GPS position on the map and is not a substitute for an official flight weather briefing or your own in-flight decisions.

How long do offline route packages stay valid?

Up to 7 days. The package shows its age visibly and clearly flags it once validity has expired – use a fresh connection for a current decision after that.

What's on the briefing PDF I share?

Assessment, current observed and model values, reasoning, official warnings, hourly trend and forecast days – with an active route, also a VFR corridor map with per-leg risk. Every page carries a snapshot and disclaimer notice plus a discreet mention of VFR Wetter; the last page adds a QR code to the Play Store listing.

How do I see whether a regional model or only standard weather was used?

The data source status page in the Current tab transparently lists which source was active, which served as a fallback, and which isn't available at all at this location – with no extra network requests.

Can I see the exact assessment logic in detail?

We deliberately don't publish the exact weighting of individual weather factors. But "Why this assessment?" always shows the reasons that mattered for the current assessment in this specific case.

Does the raw METAR change with the language too?

No. The UI, professional assessments and plain-language translations switch with the language – raw flight weather reports, ICAO codes and proper names deliberately stay unchanged.

Still have questions?

Find more answers in the FAQ on the homepage, or reach out via the support page.

Go to support